Jitterbug
I once chased down a production API that kept throwing bursts of 500s. Traffic was steady all day, but the errors came in waves on a regular cadence.
The service itself was simple. It read from a database and cached full responses in Redis using the request URL as the cache key with a fixed TTL. Clients tended to ramp up traffic around the same time, so a large batch of keys was created in the same window. When those TTLs expired, they expired together.
That synchronized expiry caused a thundering herd. Cache misses surged and the web server had to refill most of them at once. That saturated the database connection pool, and any requests stuck waiting on it timed out as 500s.
Rather than overprovisioning database connections for a predictable burst, I added jitter to cache TTLs so keys would expire over a range instead of all at once. That change worked immediately.
To dig into why it works, I built Jitterbug, a reproducible load test that runs static and jittered TTLs side by side under heavy traffic and graphs both in Grafana.
Setup
The test app has two endpoints backed by Redis:
/static/data?id=N/jitter/data?id=N
Both cache the full response by URL, so every id gets its own key. The only difference is the TTL. Static uses a fixed 10 second TTL, while jitter picks one between 10 and 15 seconds:
from typing import Literal
import random

Mode = Literal["static", "jitter"]

STATIC_TTL = 10  # seconds
MAX_JITTER = 5   # seconds


def _ttl_ms(mode: Mode) -> int:
    if mode == "static":
        return STATIC_TTL * 1000
    jittered_ttl = STATIC_TTL + random.uniform(0, MAX_JITTER)
    return int(jittered_ttl * 1000)
The ID space is finite at 0..999, so each endpoint has 1000 possible keys. On a cache miss, the app simulates backend work with a 20 to 50ms delay before writing to cache.
Stack
The full stack runs in Docker and consists of:
- FastAPI: web server for the
/static/dataand/jitter/dataendpoints - Redis: response cache
- Locust: load generator that drives traffic at a fixed target rate
- VictoriaMetrics: metrics backend that scrapes
/metricsevery second - Grafana: dashboard used to visualize miss rates and latency
  graph LR
    L["<strong>Locust</strong><br/><span class='mermaid-detail'>1500 users, 4 processes</span>"]
    W["<strong>FastAPI</strong><br/><span class='mermaid-detail'>/static/data?id=N<br/>/jitter/data?id=N</span>"]
    R[("<strong>Redis</strong><br/><span class='mermaid-detail'>Cache</span>")]
    VM["<strong>VictoriaMetrics</strong><br/><span class='mermaid-detail'>scrape every 1s</span>"]
    G["<strong>Grafana</strong>"]

    L -->|"HTTP load"| W
    W -->|"cache read/write by full URL key"| R
    W -->|"/metrics"| VM
    G -->|"PromQL queries"| VM
Traffic was split evenly between static and jitter endpoints. Locust ran with 1500 users across 4 processes and targeted about 10.5k requests per second total. In steady state, each endpoint sat around 5.2k req/s.
The app exports Prometheus counters for cache hits and misses plus a latency histogram, all labeled by mode. Scraping every second keeps the short TTL cycles visible.
Dashboard
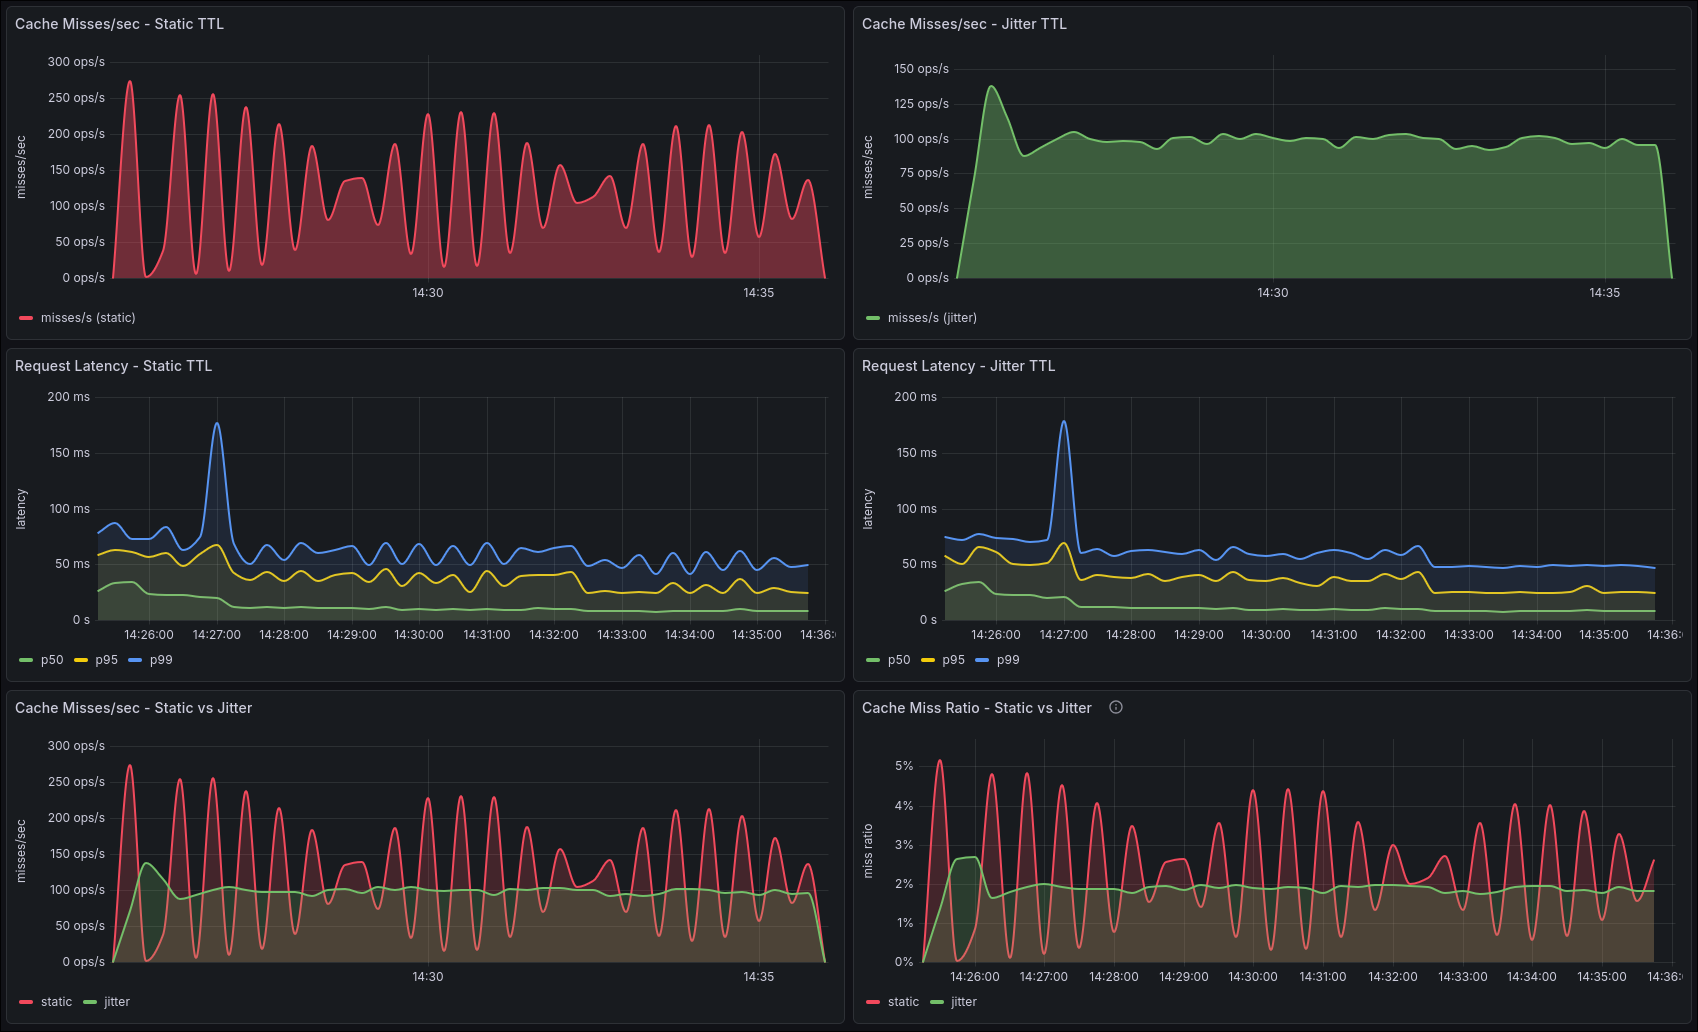
The first row tracks cache misses per second for each endpoint. Static shows recurring spikes, while jitter stays in a narrow band.
The second row tracks p50, p95, and p99 latency. Static’s latency wobbles in step with its miss spikes, while jitter’s stays flatter.
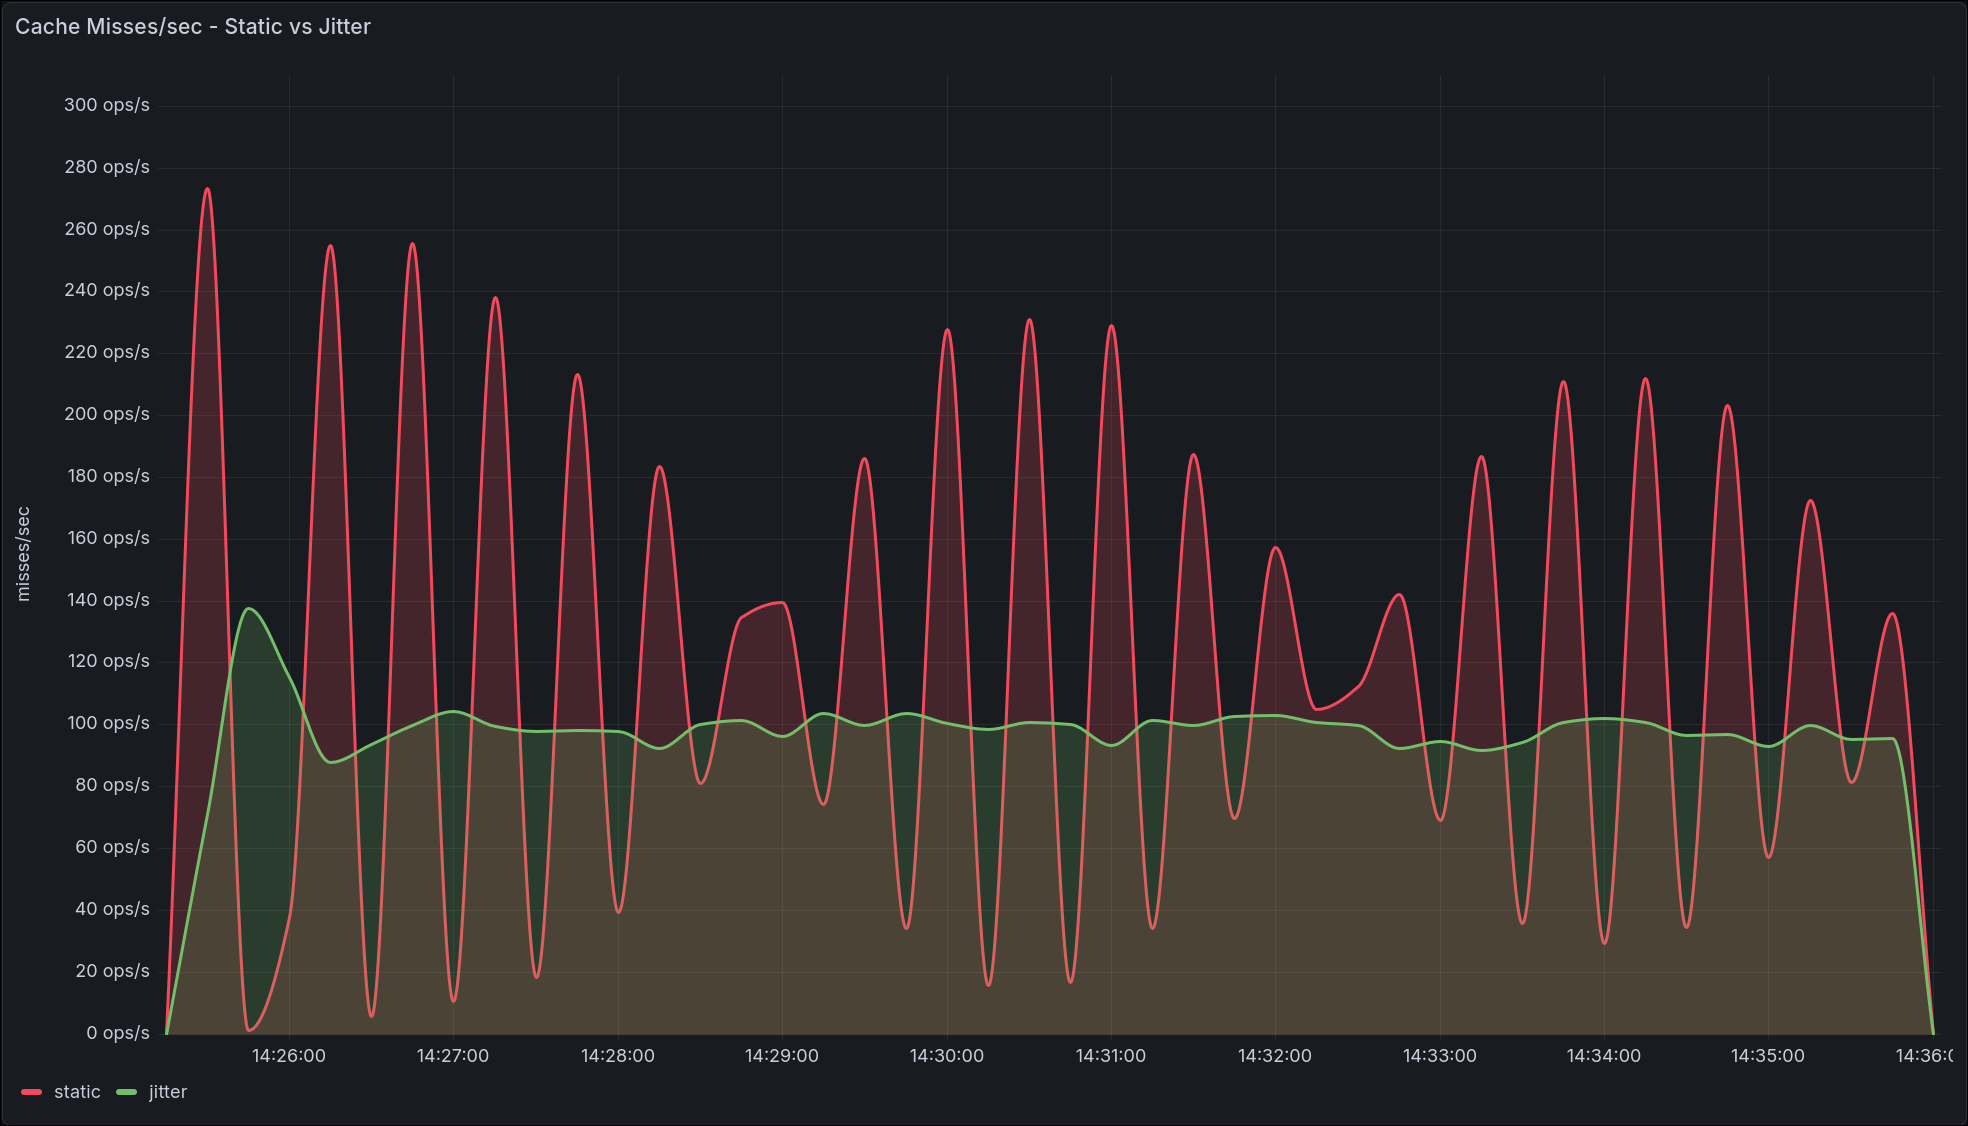
The third row overlays the two. Misses per second shows the raw difference, and the miss ratio panel normalizes it by request volume.
Results
In a representative 10 minute run on my machine, the system handled about 6.25 million requests at around 10.4k req/s without any failures.
Latency stayed low at this load level, with p50 around 16ms, p95 around 50ms, and p99 around 74ms.
The static route recorded about 73k misses and jitter about 59k, a miss ratio of 2.35% versus 1.88%. Most of that gap comes from jitter’s longer average TTL (12.5 seconds versus 10), which you’d also get by raising the static TTL. What jitter actually changes is how those misses arrive. Static swung from near zero up to 200 to 275 misses per second, while jitter held steady around 100. Under the same traffic, jitter’s peak miss rate was about half of static’s.
Why it works
With fixed TTLs, keys created around the same time expire around the same time, and that synchronization is what creates miss storms. Jittered TTLs spread the expirations out, so the backend handles its misses as a smoother stream.
That’s what matters, because your database has to be sized for the peak, not the average. Jitter lowers the peak.
Takeaways
If you cache hot API responses with a fixed TTL, adding a small random offset is a one-line change that pays for itself the first time your traffic spikes.
Jitter won’t stop concurrent requests from missing the same key while it refills, though. Both endpoints took roughly 20% more misses than their TTLs alone would predict because requests kept landing on keys mid-refill. If that matters for you, put a lock or request coalescing in front of the refill.
If you want to reproduce this yourself, clone the repo, run the stack, and watch the miss and latency panels side by side. You’ll see the difference within the first minute.